Virus Levels in Your Community
Wastewater data helps us understand how flu and COVID-19 viruses might be changing or spreading in the community, even before people start to feel sick. When levels are high or increasing in your area, it may be a good time to take extra steps to protect yourself from getting sick.
Our interactive dashboard displays up-to-date wastewater monitoring data from samples collected at wastewater treatment facilities across Vermont.
How We Monitor Illness Activity
The Health Department monitors flu and COVID-19 activity and vaccine coverage in the state throughout the year. Timely data helps us understand how diseases are spreading. We collaborate with health care providers, laboratories, clinics, emergency departments, CDC, and other state health departments to track measures like:
- Emergency department visits for flu-like illness
- Emergency department visits among people with confirmed COVID-19
- Wastewater monitoring
- Flu subtype and strain testing
- Reported outbreaks
National Data
Find respiratory illnesses activity in the United States: Respiratory Illness Data Channel (CDC)
Past Weekly Reports
2026
- July 8
- July 1
- June 24
- June 17
- June 10
- June 3
- May 27
- May 20
- May 13
- May 6
- April 29
- April 22
- April 15
- April 8
- April 1
- March 25
- March 18
- March 11
- March 4
- February 25
- February 18
- February 11
- February 4
- January 28
- January 21
- January 14
- January 7
2025
- December 31
- December 24
- December 17
- December 10
- December 3
- November 26
- November 19
- November 12
- November 5
- October 29
- October 22
- October 15
- October 8
- October 1
- September 24
- September 17
- September 10
- September 3
- August 27
- August 20
- August 13
- August 6
- July 30
- July 23
- July 16
- July 9
- July 2
- June 25
- June 18
- June 11
- June 4
- May 28
- May 21
- May 14
- May 7
- April 30
- April 23
- April 16
- April 9
- April 2
- March 26
- March 19
- March 12
- March 5
- February 26
- February 19
- February 12
- February 5
- January 29
- January 22
- January 15
- January 8
Wastewater Monitoring for Flu and COVID-19
The dashboard shows wastewater testing results for influenza A, the most common seasonal flu virus in humans, and SARS-CoV-2, the virus that causes COVID-19. Data come from participating water treatment facilities in Burlington, Essex Junction, South Burlington, Middlebury, Montpelier, and Ludlow.
Water samples are collected 1-3 times a week and are tested at either WastewaterSCAN or Verily laboratories. RSV may be added to the dashboard in the future, as well as additional participating water treatment facilities.
The dashboard is updated every Tuesday, reflecting the prior week's data.
Using the dashboard:
- Pick a virus from the Virus box.
- Select a site to view its data (blue line) and compare with the statewide trend (red line). Or, leave all sites unchecked to see statewide data.
- Adjust the chart time period using the slider.
- Click on a site or zoom in on the map to see the sewershed.
- Click Download Data to access the raw data.
FAQs
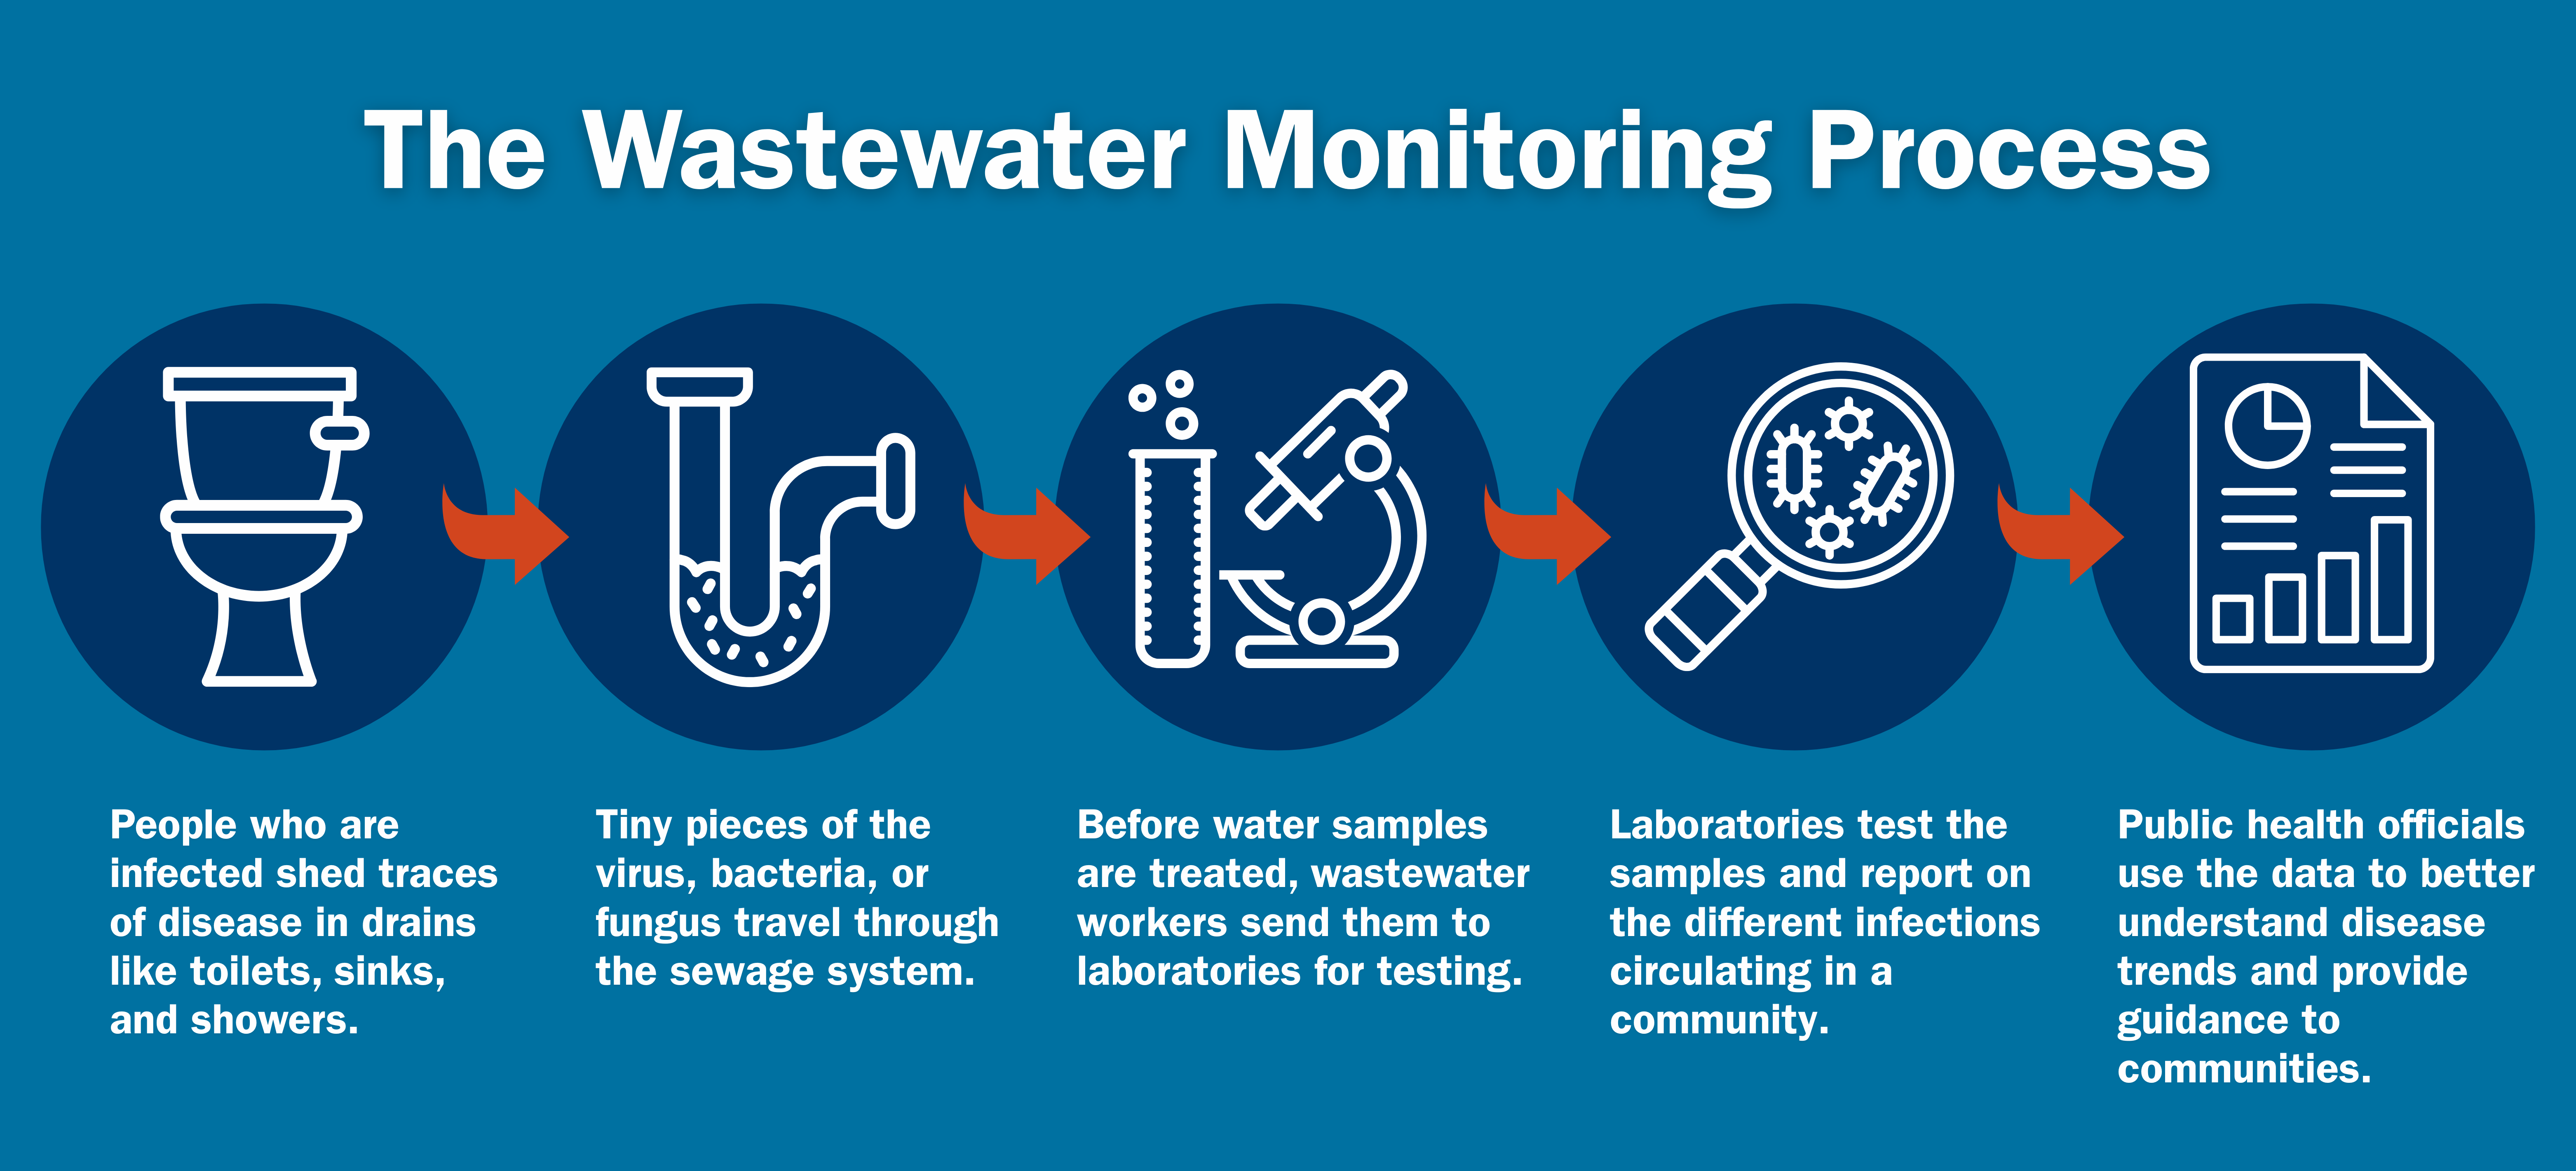
Whenever people flush the toilet, wash their hands, take a shower, or spit toothpaste down a drain, they can shed traces of infectious diseases if they are infected—even if they have no symptoms. The pieces of virus, bacteria or fungus travel from the drain through the sewage system.
In a wastewater monitoring (or surveillance) program, wastewater operators take a sample of the water before it’s treated and send it to a lab for testing. The lab tests the water samples to detect and report on different types of infections that are in the water from that community.
Learn more about how it works (CDC)
Wastewater data can provide a community-level perspective on what diseases are circulating locally, without relying on people visiting a doctor or getting tested for an infectious disease.
Monitoring wastewater can be an early warning for public health, medical professionals, and the public of the presence of infectious diseases. It can also detect the start of seasonal viruses, or later, show that the spread is slowing down.
The results from wastewater monitoring help public health officials better understand disease trends in communities and take actions, such as providing guidance on how to prevent infections, or increasing testing or vaccination options.
While the data doesn't show how many people are actually sick or needing medical care, high or increasing virus levels may mean that there is an increased risk of infection. Take simple steps to protect yourself and others. Wash your hands often, wear a mask in crowded places, stay up to date on vaccines, and be extra careful around people at higher risk of serious illness.
Wastewater monitoring shows how much virus is circulating in a community, whether or not people are showing symptoms. The data gives us a general picture of what’s happening, but it represents only a sample of the population.
For example, people using septic systems, disposable diapers, or who are connected to water treatment facilities not participating in the program may not be represented in the data.
Other environmental factors, like heavy rain or snowmelt, can also affect wastewater virus levels.